
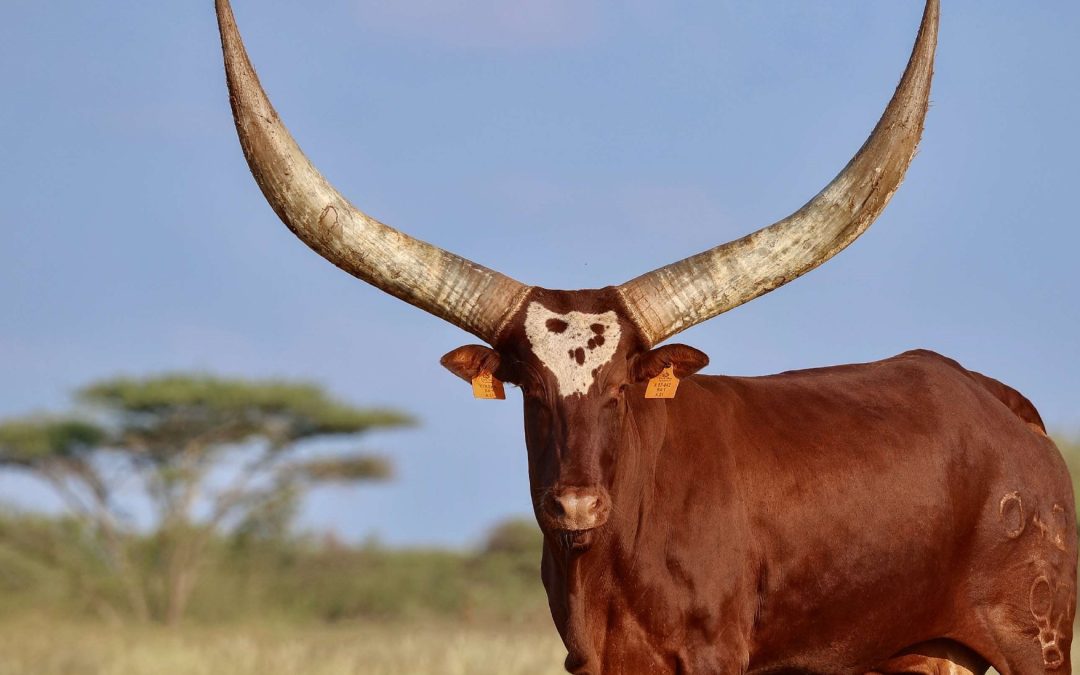
From Oocyte to Calf: What 4,600 Oocytes Have Taught Us About Ankole ET — You Have to Look at the Mom!
Results from three years of OPU and embryo transfer, May 2023 – June 2026
In August 2024 we published our first set of embryo transfer results and promised to keep sharing what we learn. Two years on we have a much bigger data set, and this time we have gone back further in the process — all the way to the oocyte.
We have analysed every step of the chain: oocytes aspirated, embryos made in the lab, embryos transferred, and pregnancies confirmed. Where our first report only looked at what happens after the embryo exists, this one asks a harder question: of everything we do, what actually changes the number of calves on the ground?
As before, our intention is to share findings from a large and consistent data set. These results reflect our operating model, our veld and our climate in Limpopo. We make no claim about how they translate to other models — but the method of asking these questions will translate to any herd.
The Headline Numbers
| Measure | Value | Comments |
|---|---|---|
| Oocytes aspirated and matured | 4,623 | |
| Embryos produced | 998 | 21.6% of oocytes |
| OPU aspirations analysed | 402 | |
| Average oocytes per aspiration | 11.5 | |
| Average embryos per aspiration | 2.5 | |
| Embryos transferred with a recorded outcome | 628 | 62.9% of embryos |
| Confirmed pregnancies | 227 | 36.1% per transfer |
| Oocytes per confirmed pregnancy | 12.8 | |
| Oocytes per calf born | 16.4 | net of early loss |
What We Count Against a Calf
When we work out what a calf costs us in oocytes we distinguish a confirmed pregnancy from a calf. We lose roughly a sixth of confirmed pregnancies before birth, so a calf on the ground costs about 16.4 oocytes against about 12.8 for a confirmed pregnancy.
Where the Losses Happen
Of every 100 oocytes we commit to the transfer programme:
- about 22 become embryos
- about 8 become confirmed pregnancies
- about 6 become calves
The biggest single loss by volume is in the lab, at the oocyte-to-embryo step. But volume of loss is not the same as opportunity for improvement. We are not blaming our own lab, or that of our partners — that step is already broadly in line with what the industry achieves. Switching between labs is tempting, especially after a disappointing round, but it is most likely not the area to focus on! The real leverage sits somewhere else entirely — in which cow is offered for OPU.
Finding 1: The Cow Is the Master Variable
This is the strongest, cleanest result we have, and it is the one we would stake money on. Which cow you flush is the largest single driver of both how many oocytes you get and how many of them become embryos — and it stays the largest after we account for the year, the season and the cow’s age.
Grouping our fifty ranked donors into quartiles on embryos produced per session:
| Donor quartile | Sessions | Oocytes per session | Conversion | Embryos per session | Oocytes per calf born |
|---|---|---|---|---|---|
| Top 25% | 101 | 15.6 | 37% | 5.83 | 9 |
| Second 25% | 109 | 11.5 | 19% | 2.24 | 18 |
| Third 25% | 117 | 9.4 | 11% | 1.03 | 32 |
| Bottom 25% | 76 | 8.1 | 4% | 0.29 | 98 |
Those quartile figures are counted, not modelled: the top quartile produced 589 of our 975 attributable embryos, the bottom quartile 22. Our best individual cows deliver a calf for every 6 to 8 oocytes. Seventeen of our fifty ranked cows need more than 30. Taken together the bottom quarter of the list needs about 98.
The top half of our donor list produced 833 of our 975 embryos — 85% — from 210 of our 403 sessions. That is about 5.4 times the embryos per session of the bottom half — 3.97 against 0.74 — for exactly the same session cost.
This Is a Concentration Argument, Not a Waste Argument
So the prize is concentrating capacity on the best cows, not reclaiming capacity we were squandering. That matters for what you do next: the binding constraint is how many good donors you have, which makes expanding your productive core a precondition for the main action rather than a nice-to-have. Put simply, if you want to use embryos as your chosen expansion route, you need to expand your number of productive cows! Hence, at Fire Sky our initial focus was on top proven female genetics, now we are filtering for fertility and also for performance as a donor.
Nobody sold us a bad cow; we simply had not measured the right thing. Reputation, horns and pedigree tell you what an animal is worth as a breeding female. They do not tell you what she is worth as a donor. Only her own OPU record does that.
For scale, our ten highest-producing donors account for 99 of our 227 confirmed pregnancies — 44% — from 223 of our 628 transfers. That is a real concentration, and it is the argument for pruning a donor list.
Does this mean we will dump our less productive cows on unsuspecting buyers? Certainly not! For example, we do own 3 old foundational cows — which although they are no longer fertile — are true examples of top genetics in our breed. Our intention is to clone them once the viability of it is better established. The cows that are not above average donors are all still fertile and are being used for conventional breeding and AI. You will never buy an infertile cow from Fire Sky!
Finding 2: Season Matters, But Far Less Than the Raw Numbers Suggest
Looked at naively, the seasonal pattern is dramatic:
| Season | Sessions | Oocytes per session | Conversion | Embryos per session |
|---|---|---|---|---|
| Summer (Dec–Feb) | 104 | 14.5 | 26.1% | 3.79 |
| Autumn (Mar–May) | 239 | 10.2 | 21.0% | 2.14 |
| Winter (Jun–Aug) | 69 | 9.7 | 13.7% | 1.33 |
| Spring (Sep–Nov) | 0 | — | — | — |
On those numbers a summer session makes nearly three times the embryos of a winter one. The trouble is that our seasons are not spread evenly across the years, and we have got a great deal better at this process over three years — from 0.85 embryos per session in 2023 to 4.11 in 2026.
Sessions by season and year
| Season | 2023 | 2024 | 2025 | 2026 |
|---|---|---|---|---|
| Summer | 0 | 48 | 10 | 46 |
| Autumn | 27 | 156 | 31 | 25 |
| Winter | 25 | 32 | 0 | 12 |
We have never done a summer session in 2023, and more than a third of our winter sessions come from 2023 — our worst year. The summer-versus-winter comparison is largely a 2026-versus-2023 comparison wearing a seasonal label.
The test that settles it is 2024, the only year in which we worked in all three seasons:
| 2024 only | Sessions | Oocytes per session | Conversion | Embryos per session |
|---|---|---|---|---|
| Summer | 48 | 9.0 | 23.3% | 2.08 |
| Autumn | 156 | 9.7 | 20.8% | 2.03 |
| Winter | 32 | 9.8 | 17.9% | 1.75 |
Within a single year, summer gave us the fewest oocytes per session of the three seasons. The oocyte-yield effect does not survive once the year is accounted for. The conversion effect does survive the year — but not once we also account for which cow was flushed, because we happened to put our better cows up for OPU in our later, warmer sessions.
What We Believe About Season
There is a real summer advantage in embryos per session and it is worth having: about +0.86 embryos per session, roughly one and a half times winter. But the 95% interval on that figure runs from essentially zero to +1.71, so treat it as directional only — it is the weakest link in our improvement chain. Our practical advice: if you have a free choice of month, take December to February, because it costs nothing to schedule that way. Do not rebuild your year around it, and do not defer a session on a good cow in order to wait for summer — donor quality outweighs season by a wide margin. And we have still never done OPU in spring, so that window remains a complete blank.
One further thought: if summer helps because of green feed and better body condition, then the real lever is donor condition at aspiration — and that is something you can influence all year round.
Finding 3: The Bull Matters at the Last Step, But No Single Bull Is Proven
The bull has no reliable effect on how many oocytes turn into embryos. We tested it directly and found nothing (p = 0.11).
The bull does appear to affect whether those embryos implant. Comparing bulls only against other bulls used in the same transfer round — which, as we explain below, is the only fair comparison — our bulls differ as a group, and the spread between best and worst is about 38 percentage points of pregnancy rate.
That group result is a single test answering the question “do bulls differ at all?” It came out at p = 0.047, which is real but not overwhelming. It is not nine separate verdicts about nine individual bulls. When we look at each bull on its own, every single confidence interval includes “no effect at all.”
What This Means in Practice
Our two apparently best bulls (Zeus and Dyambo Junior) are our best available bet, and we use them as our defaults for pregnancy-focused transfers. That is a sensible decision under uncertainty — but it is a working preference, not a proven ranking. We extensively use ‘brand’ bulls like Optimus Prime, Maximus, Cumulus, Uganda and Jupiter, but that is for genetic variety and out-breeding, not for its embryo implant success. Our two ‘new genetics’ bulls, NextGen and Novus, both gave exceptional results, but both of them were only used during our two best ever sessions earlier this year! On this much data we cannot distinguish any individual bull from the herd average. The only way to fix that is to stop rotating bulls between rounds and start running two side by side within the same round, on comparable recipients. We did that for this year’s rounds, but the results will only be available in 7 months’ time!
The bulls that make the most embryos are not the bulls whose embryos implant best. In our data the two are unrelated. Our best converter is among our weakest on pregnancy. Two bulls that look poor on embryo numbers are among our most promising on pregnancy. If you judge a bull on embryos per flush, you will sometimes pick exactly the wrong bull.
A related point on measurement: we compare each bull’s conversion rate only against the other bulls used on the same day, not against our three-year herd average. A four-year average is unfair to bulls used early and flattering to bulls used recently. On a same-day basis our best raw converter goes from looking 17 points above average to about 3.
Finding 4: Our Biggest Driver of Pregnancy Is Something We Are Not Yet Measuring
When we broke down what explains our pregnancy results, the largest single factor was not the bull, not the cow, not the embryo. It was which transfer round it was.
Our rounds ranged from 18% to 53% pregnancy on a like-for-like basis. That swing is larger than any genetic or procedural effect we measured, and it accounts for close to half of everything we can explain.
We cannot fully tell you why, because the answers are not in our records. What we can tell you is what it is not. It is not season — rounds in the same season differ enormously. It is not heat — our best round was February, in peak Limpopo heat, and our worst was June, while December, also peak heat, ran 26%.
We also looked at whether recipients prepared off-farm did better than those prepared at home. On like-for-like fresh embryos the two groups came in about a point apart. But the two groups had no recipient breed in common at all, so no adjustment is possible. Preparation site is ruled out.
For this report, we evaluated data where our vet partners and lab were consistent, so although the human (vet) aspect at OPU and transfer is obvious, there is no practical impact we can make.
The unexplained part sits in things we have never written down: oocyte grade at aspiration, embryo handling times, recipient parity, and semen batch. That is now our main record-keeping project. Regardless, even if we find no additional driver we can influence, we now know how to optimise our production pipeline on what we have discovered so far!
Finding 5: Several Things We Worried About Do Not Matter
Once we account for which round a transfer belonged to, none of the following reliably changed pregnancy:
- Embryo stage at transfer (morula, blastocyst, expanded blastocyst)
- Embryo grade
- Which ovary carried the CL, left or right
- Recipient synchrony day
- Whether the recipient was a crossbred or purebred female
- Recipient breed type
That last one is worth dwelling on. Looked at naively, our dairy-type recipients showed a 51% pregnancy rate against 35% for beef-type — a difference we would happily have acted on. But those dairy recipients happened to be concentrated in our good rounds. Once we compared like with like, the advantage vanished completely (p = 0.73).
Fresh still beats frozen (42.5% against 32.1%) and fresh remains our default. But within rounds the difference is not statistically separable (p = 0.15), and whole rounds tended to be all fresh or all frozen. We stand by the direction and we do not quote a size for the advantage.
We also lost roughly 16% of confirmed early pregnancies before birth. That figure rests on the 37 pregnancies we lost out of 227 — about one in six, and not a random sample — so treat it as indicative.
Although we have also seen a significant improvement over the last 4 years, we still use 15% for pre-birth absorption for planning and budgeting purposes.
Finding 6: Two Things That Look Like Findings, and Are Not
Donor Age Is Not a Cliff at Eleven
Embryos from dams aged eleven and over run at 26% pregnancy against about 39% for younger dams, and that gap holds up when we adjust for transfer round. But once we also test it against the identity of the individual cow, the age band carries no information at all (p = 0.90).
The reason is visible as soon as you look at the individual animals. Three of our best pregnancy performers are eleven or over. Three of our worst are too. The band average is a mixture of good old cows and bad old cows, not a decline. A blanket rule to retire donors at a specific age would have removed four cows we actively want to keep, including the best converter in our herd.
What we do: judge each cow on her own record, not her birth year. Age is a reason to bring her daughters into the programme early, not a reason to retire a cow who is still performing.
We Cannot Tell Whether Middle-Sized Transfer Days Do Better
Our days of 46 to 70 transfers ran at 53% pregnancy while smaller and larger days ran at about half that. It is tempting to call that a finding. It is not one, because our day sizes are almost perfectly nested inside our rounds. Our only day above seventy transfers is a single day in December 2023 — so “big days do badly” is really just “that round did badly.” And our three days in the 46-to-70 band all fall inside the two best rounds we have ever had. The odds ratio of 9.7 for that band carries a 95% interval running from 1.2 to 81.
What we do: planning transfer days of fifty to seventy is harmless and plausible on handling grounds, so we still do it. It is a hypothesis, not a result, and you should not reorganise your programme around it.
For Stats Nerds Only: How Much Does Each Factor Actually Matter?
Everything above says a factor matters or it does not. This section puts numbers on it: how much of the final result each factor drives across the whole chain from oocyte to calf. We include it because the ranking surprised us, and because we think the caveats attached to it are as useful as the numbers themselves.
The method in one paragraph. We split the chain into three stages — how many oocytes a session yields, how many of those become embryos, and how many transferred embryos become pregnancies. For each stage we work out what share of the variation each factor explains, then weight the three stages by how much each contributes to the final output. Each factor is entered as a single adjusted measure rather than as a set of categories, which matters: give a factor with fifty levels (like cow identity) one column per level and it will win on arithmetic alone, whatever the biology.
| Factor | Combined weighting | Where it mainly acts |
|---|---|---|
| Donor (dam) identity | 65.3% | Both production stages |
| Transfer round | 9.8% | Pregnancy |
| Sire | 6.4% | Pregnancy |
| Year / period | 5.7% | Oocyte yield |
| Dam age | 4.9% | All three, weakly |
| Season | 3.5% | Both production stages |
| Fresh vs Frozen | 1.7% | Pregnancy |
| Embryo stage | 1.6% | Pregnancy |
| Recipient breed type | 0.9% | Pregnancy |
| Sire age | 0.1% | Pregnancy |
Which cow is on offer is close to two thirds of everything — more than every other factor combined, and roughly ten times the bull. If you take one number from this report, take that one. I promise you: this is the last time I will say I told you so! You have to look at the Mom!
Where Each Factor Acts
The combined figure hides something worth seeing: most factors only operate at one stage of the chain. Each column below sums to 100% of what that stage explains.
| Factor | Oocytes per session | Oocyte to embryo | Embryo to pregnancy |
|---|---|---|---|
| Donor (dam) identity | 70.8% | 88.6% | 3.8% |
| Transfer round | — | — | 45.4% |
| Sire | — | 2.3% | 24.3% |
| Year / period | 16.4% | 2.2% | — |
| Dam age | 8.6% | 2.3% | 6.1% |
| Season | 4.2% | 4.5% | — |
| Fresh vs Frozen | — | — | 8.0% |
| Embryo stage | — | — | 7.3% |
| Recipient breed type | — | — | 4.4% |
| Sire age | — | — | 0.7% |
Read across the donor row and the whole argument of this report appears. The cow almost entirely determines how many embryos you get, and almost not at all whether they implant. The bull is the mirror image — nearly irrelevant to embryo numbers, second only to the round for pregnancy. That is exactly why neither animal can be judged on a single stage, and why ranking a bull on embryos per flush will sometimes hand you the wrong bull.
How the Three Stages Are Weighted
The stage weights are a range rather than a single number. We tested three defensible ways of measuring how much each stage contributes, and they disagree with one another:
| Definition | Oocytes per session | Oocyte to embryo | Embryo to pregnancy |
|---|---|---|---|
| Variance of log outcome across donors | 27.2% | 50.3% | 22.5% |
| Same, weighted by sessions | 26.6% | 47.9% | 25.5% |
| Squared coefficient of variation | 30.2% | 53.1% | 16.7% |
| What we used (mean of the three) | 28.0% | 50.4% | 21.6% |
Conversion carries the most weight under all three definitions, because our cows differ far more from one another at that step — from under 5% to over 50% — than at either of the others. That conclusion is robust. The exact percentage is not, and the spread between those rows is the honest uncertainty on it.
Five Things to Know Before You Use These Numbers
- They divide up what we can explain, not everything that happens. The three stage models together account for roughly 31% of the variation in output per oocyte. The rest is biology we cannot attribute to anything we write down. For pregnancy especially — a yes/no event — most of the variation is irreducible chance, and no amount of modelling will recover it.
- The percentages compare properly within a stage, only loosely between stages. Oocyte yield is a count; conversion and pregnancy are yes/no outcomes. A variance share for a yes/no outcome is mechanically smaller than one for a count with the same real effect behind it. So “donor explains 70.8% of oocyte yield” and “round explains 45.4% of pregnancy” are not quite the same currency, and a table like this will always flatter the production stages a little relative to the transfer stage.
- The production-stage figures are the least independently checked part of this analysis. The two production stages carry about four fifths of the total weight, and their internal shares are the one part of this work we have not been able to reproduce from source — they need a session-level file we cannot verify in the form we hold it. We publish them as computed. What we can confirm from directly counted records is the thing they mainly say: the top half of our donor list produced 85% of our embryos from 52% of our sessions, a 5.4-fold difference per session. The donor conclusion therefore rests on counted evidence even where the exact percentage above does not.
- A small weighting does not mean “ignore it.” Fresh versus frozen scores 1.7% and we still default to fresh, because doing so costs us nothing. A weighting tells you where extra effort is worth spending, not what to stop doing.
- This is observational farm data. Nothing was randomised. These are associations, and an association can be standing in for something else entirely — season stood in for year until we tested it, and dam age turned out to be standing in for four particular cows. Every factor in that table has been tested against the obvious rival explanation, but we cannot test against explanations we have not thought of.
What We Would Want a Reader to Do With This Table
Not reproduce our percentages — they are ours, from our herd and our records. Reproduce the exercise. Split your own chain into stages, work out where your own variation sits, and see whether your donors dominate the way ours do. If they do, the practical conclusion follows without needing any of the arithmetic above: measure your cows individually, and act on what you find.
How We Interpret All of This
- The process is far more variable than it looks from the outside. Two identical-looking rounds can differ by thirty percentage points. Anyone quoting you a single pregnancy rate without a range is not telling you the whole story.
- Selection beats optimisation. A lot of energy is spent fine-tuning embryo stage, grading and transfer technique. Almost none of it moved the needle. Choosing the right cow moved it enormously.
- Averages hide the money. Our herd figure of 16 oocytes per calf is a blend of cows needing 6 and cows needing 62.
- You cannot judge any animal on one stage of the process. Not the cow, not the bull. Only the full chain from oocyte to calf ranks them correctly.
- Compare only things that happened at the same time. Same round for transfers, same day or same season for collections. Comparing across time and crediting the difference to whichever factor you happen to be looking at is an easy mistake, and it is very hard to see from the inside.
The Only Part You Should Read if You Are Not Into Numbers, Stats or Detail: Our Recommendations to Fellow Ankole Farmers
- Rank your donors on embryos per session. Keep an honest record for every cow: oocytes collected, embryos made, embryos transferred, pregnancies confirmed, calves born. After three or four sessions you will know which quarter of your herd she belongs in. This is by far the most valuable thing in this report.
- Be ruthless about retiring donors — on their record, not their age. This is the hardest recommendation here, because the cows concerned are often beautiful animals with excellent pedigrees and real value as breeding females. A cow can be a magnificent and fertile Ankole and a poor donor. Those are separate questions and confusing them is expensive.
- Schedule toward summer if it is free to do so, but do not rebuild your year around it. There is an advantage. It is modest, its interval is wide, and it is entangled with simply getting better at the job over time.
- Choose bulls on pregnancy performance, not embryo counts — and test them properly. Use at least two bulls side by side in every round, on comparable recipients. Rotating bulls between rounds makes the comparison worthless.
- Do not over-engineer the small things. Embryo stage, grade, CL side and synchrony day did not reliably change our outcomes. Get them sensible and then stop worrying about them.
- Budget on oocytes per calf born. Not embryos per flush, not pregnancy rate, and not oocytes per confirmed pregnancy either. The cost of well-prepared recipients far outweighs the cost per embryo (if you make them yourself at scale!). Thus, oocytes per calf born is the number that reflects your whole cost base.
A Closing Thought
We are committed to this breed and always prepared to share our learnings with other serious farmers — including the findings that make us look bad, such as the sessions we spent on cows that were never going to deliver as embryo donors!
The South African Ankole gene pool is small, our national herd is small, and every one of us is working with limited genetics and limited money. We will all get further if we measure the correct things and share what we find.
If you are running an ET or OPU programme and would like to compare notes on how you are recording it, please get hold of us. We would like to see whether our summer effect — the smaller one — shows up on your farm too.
So, What Does This Mean for a Fire Sky Heifer You Are Buying?
We believe we own quality representative cows of most of the best proven genetics in the country. We use our top 10–12 donors, matching with the top bulls like Maximus, Optimus Prime, Cumulus and soon also Mr President to make heifers on scale (±50/yr). So, our offering is top proven genetics, proven fertility and not necessarily ‘scarcity’. But buyer beware: scarcity may be because there is some reproductive problem!
— Zack Swanepoel & Bernard Swanepoel, Fire Sky Ankole
A Note on the Numbers
This analysis covers our own OPU and embryo transfer records from May 2023 to June 2026: 4,623 oocytes across 402 distinct aspirations (412 session rows), and 628 transfers with a recorded outcome, 619 of which carry both dam and sire. Individual animal rates are shrunk toward the herd average using standard statistical methods, so that a single lucky or unlucky session cannot distort any animal’s ranking; group totals are counted directly rather than averaged from those shrunk rates. Factor weightings are computed by splitting the chain into three stages, apportioning the explained variation of each stage between factors, and weighting the stages by their contribution to final output; each factor is entered as a single adjusted measure so that a factor with many levels gains no artificial advantage. Every finding reported above was tested both against the possibility of it arising by chance and against the possibility of it being an artefact of when the animals concerned happened to be used. Where a finding survives that second test only weakly, we say so. Individual animal results are not published here.